One way to think about a service mesh is as a domain of control. Within a Kubernetes namespace where Istio sidecar injection is enabled, you can monitor all traffic between Pods, and enforce security policies.
But what about upstream services that live outside the mesh? How do you determine at runtime which services call external APIs? How do you know which database instance your service is writing to? Or how do you ensure that a service inside the mesh is only sending traffic within its own geographic region? Istio egress monitoring can help with this.
Egress means exit. In this case, egress traffic means requests that must exit the Istio mesh.
There was a time when Istio blocked all egress traffic by default. You had to manually create a ServiceEntry to whitelist every external host your services needed to access. A ServiceEntry adds an external host to Istio’s service registry. This changed in Istio 1.3, when the REGISTRY_ONLY egress policy became ALLOW_ANY by default. Now, in-mesh services can access external services freely, without the need for a ServiceEntry.
No matter which Istio egress option you choose for your mesh, Istio can monitor all egress traffic. And you can monitor this egress traffic through your workloads’ sidecar proxies, without needing a dedicated egress gateway proxy. Let’s see how it works.
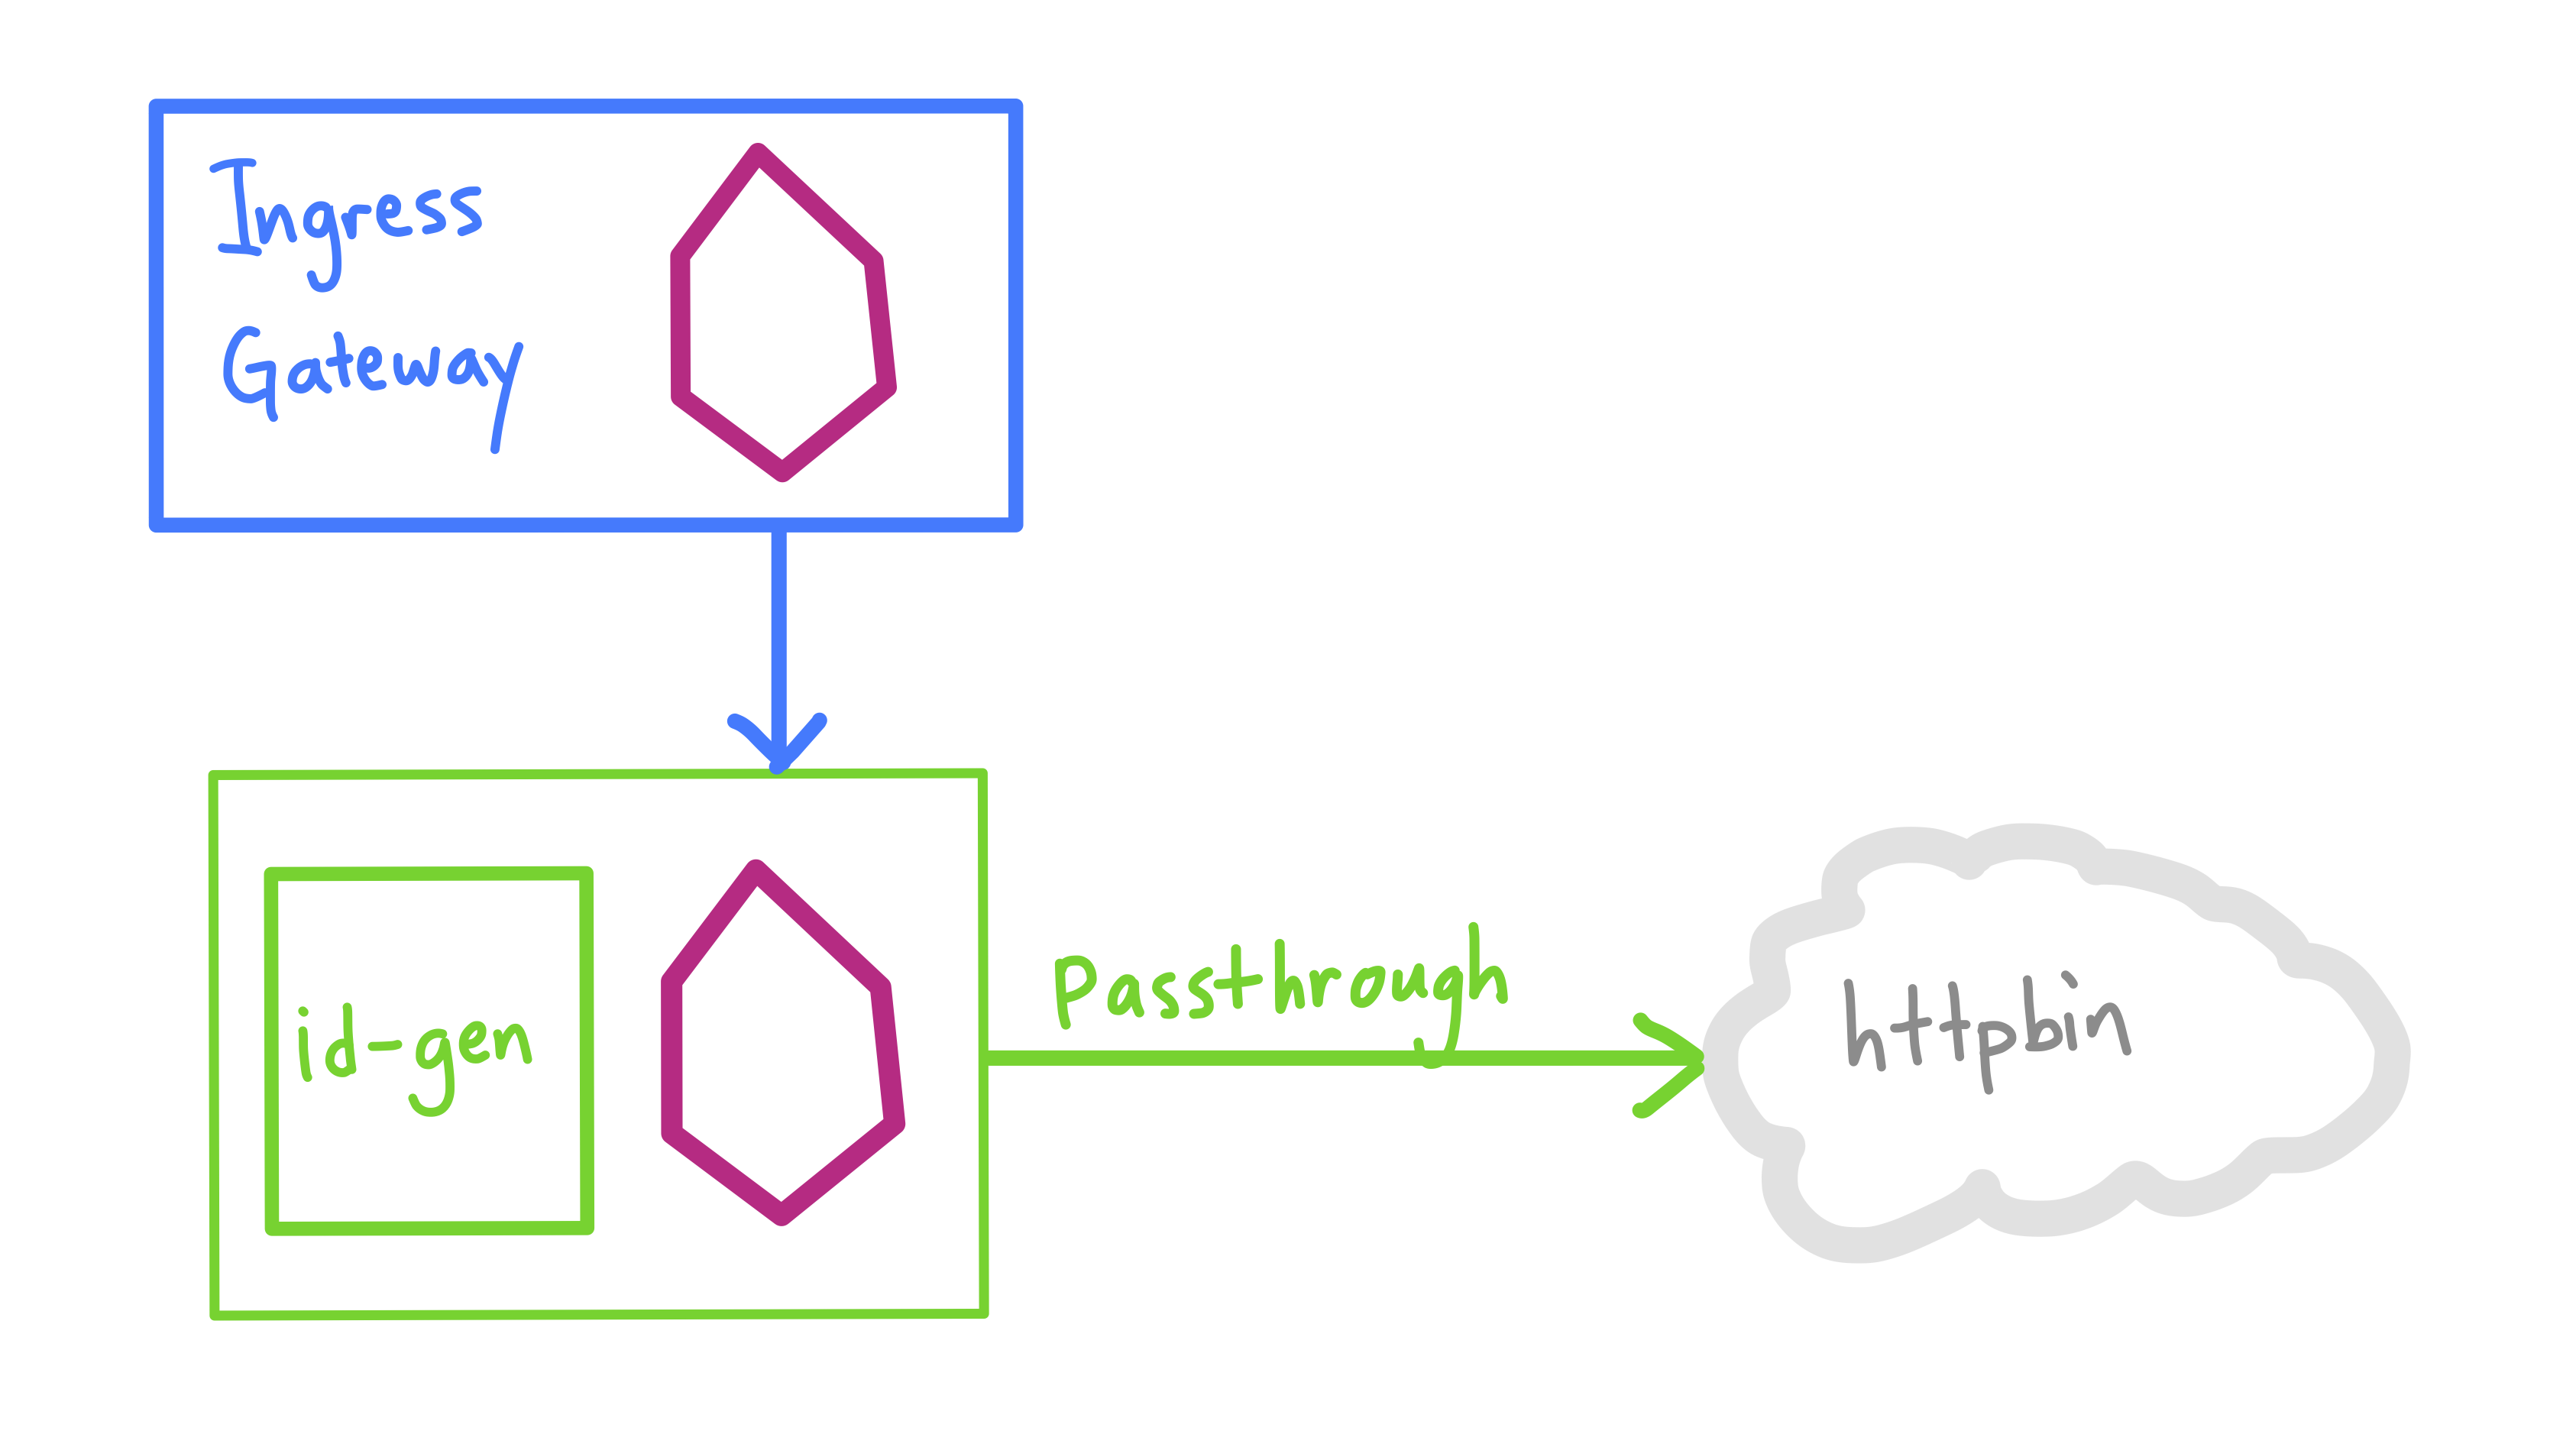
In this example, we’ve built a website that lets users share recipes. To optimize costs, the web frontend runs outside of Kubernetes as a serverless function. When a user adds a recipe, the frontend creates an ID for that recipe by calling the ID Generator service (idgen) inside a Kubernetes cluster. idgen is exposed through the default Istio IngressGateway, and gets random IDs from an external API called httpbin.
Option 1 - Passthrough
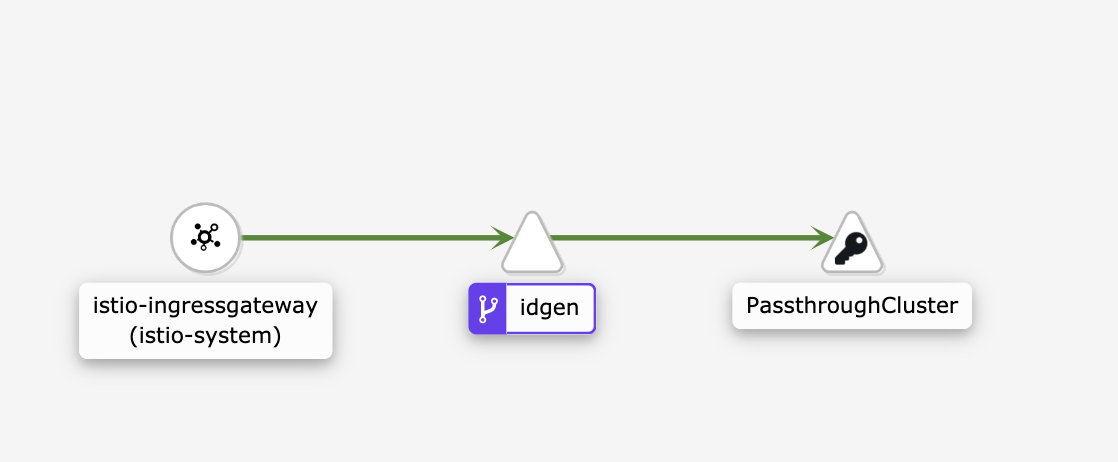
To start, let’s use an Istio installation with the default ALLOW_ANY option for egress. This means that idgen’s requests to httpbin are allowed with no additional configuration. When ALLOW_ANY is enabled, Istio uses an Envoy cluster called PassthroughCluster, enforced by idgen’s sidecar proxy, to monitor the egress traffic.
An Envoy cluster is a backend (or “upstream”) set of endpoints, representing an external service. The Istio sidecar Envoy proxy applies filters to intercepted requests from an application container. Based on these filters, Envoy sends traffic to a specific route. And a route specifies a cluster to send traffic to.
The Istio Passthrough cluster is set up so that the backend is the original request destination. So when ALLOW_ANY is enabled for egress traffic, Envoy will simply “pass through” idgen’s request to httpbin.
With this configuration, if we send recipe ID requests through the IngressGateway, idgen can successfully call httpbin. This traffic appears as PassthroughCluster traffic in the Kiali service graph - we’ll need to add a ServiceEntry in order for httpbin to get its own service-level telemetry. (We’ll do this in a moment.)
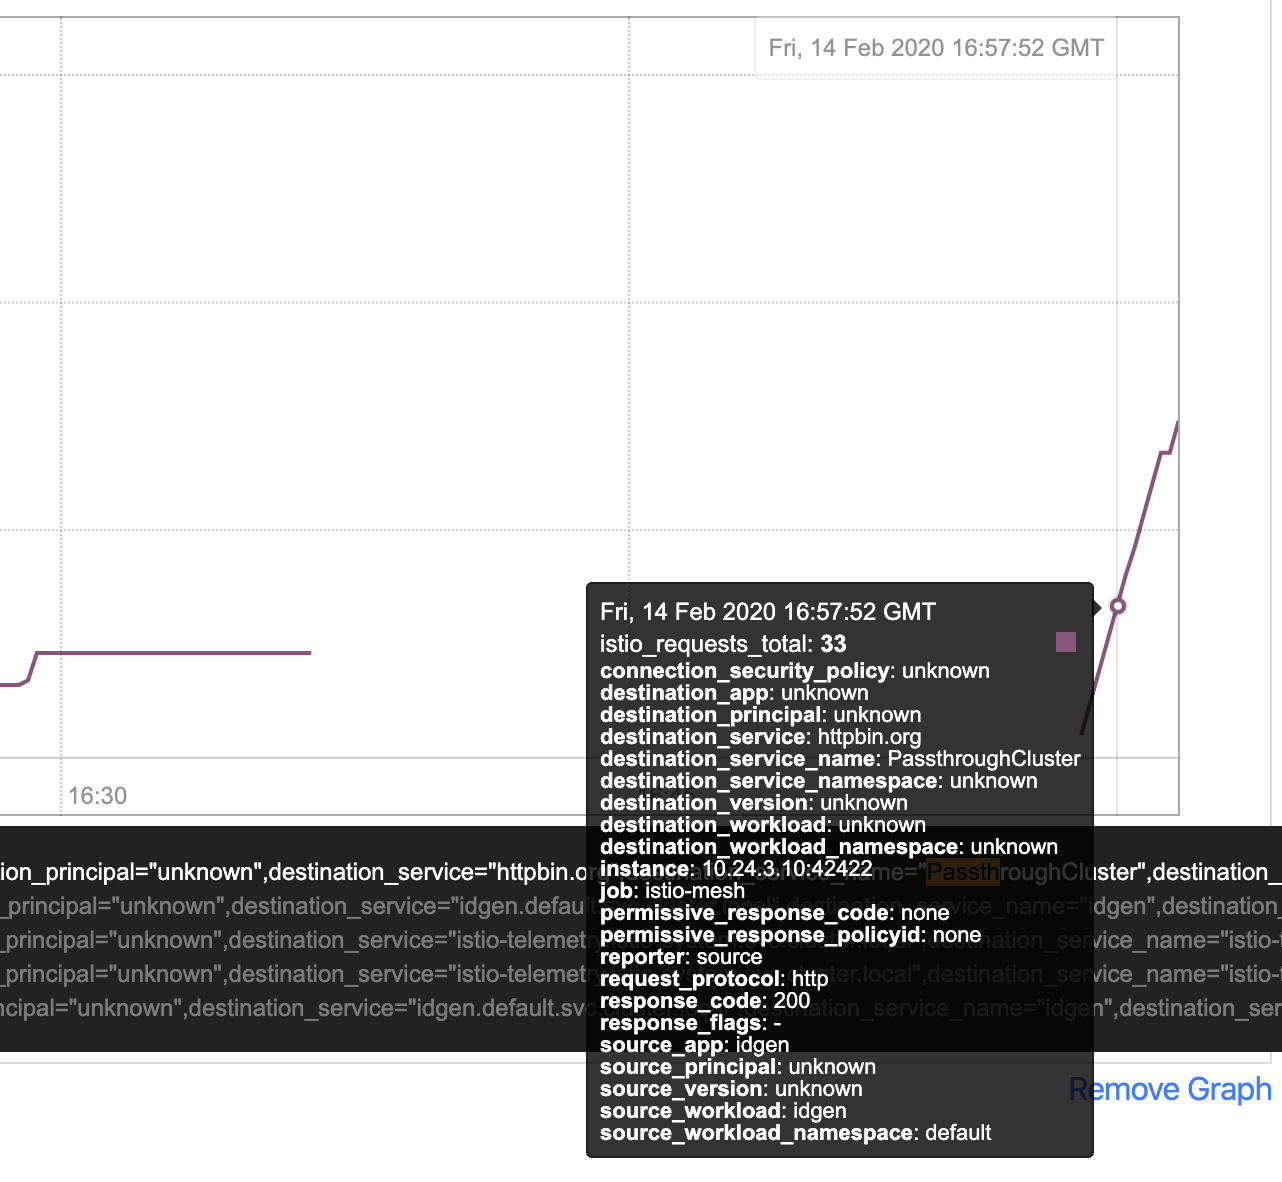
But if we drill down in Prometheus, and find the istio_total_requests metric, we can see that PassthroughCluster traffic is going to a destinationservice called httpbin.org.
Option 2 - REGISTRY_ONLY, no ServiceEntry
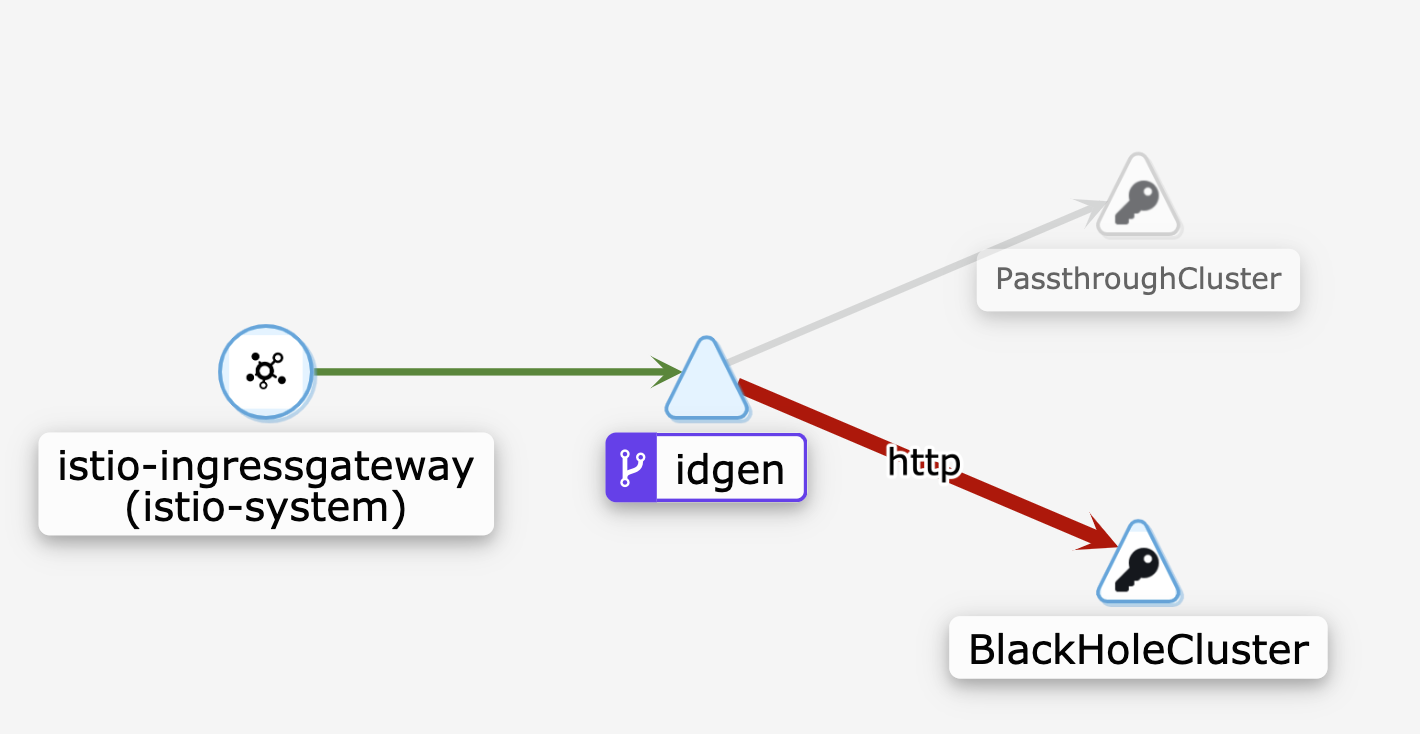
Now let’s say that before we add a ServiceEntry for httpbin, we want to lock down all egress traffic. We can do this by updating the global installation option for outbound traffic to be REGISTRY_ONLY, and re-applying the Istio install manifests.
Now, a new cluster called BlackHole comes into play. The Black Hole cluster is a backend without any IP endpoints. Requests routed to the BlackHoleCluster are dropped by Envoy, and return a 502: Bad Gateway error. In action, the collection of sidecar proxies dropping egress requests is how the REGISTRY_ONLY policy is enforced.
Once we re-install Istio with the REGISTRY_ONLY option enabled, and redeploy our idgen pod, we can see that the BlackHoleCluster intercepts the requests. A red graph edge means that HTTP requests do not complete - traffic can’t get to the desired httpbin.org endpoint.
In Prometheus, we can see that the istio_total_requests metric is accounting for BlackHoleCluster traffic. In practice, you might set an alert on this metric to detect attempted data exfiltration by a service in your cluster. In this mode, Prometheus can tell you both the source and (attempted) destination workload for the blocked request.

Option 3 - REGISTRY_ONLY with ServiceEntry
Now let’s say that we’ve gotten approval for idgen to call an external API. We’ve authorized the creation of a ServiceEntry to add httpbin to the Istio Registry:
apiVersion: networking.istio.io/v1alpha3
kind: ServiceEntry
metadata:
  name: httpbin-ext
spec:
  hosts:
  - httpbin.org
  ports:
  - number: 80
    name: http
    protocol: HTTP
  resolution: DNS
  location: MESH_EXTERNAL
Now, we can see that requests successfully exit the mesh, and are not dropped by the BlackHoleCluster:
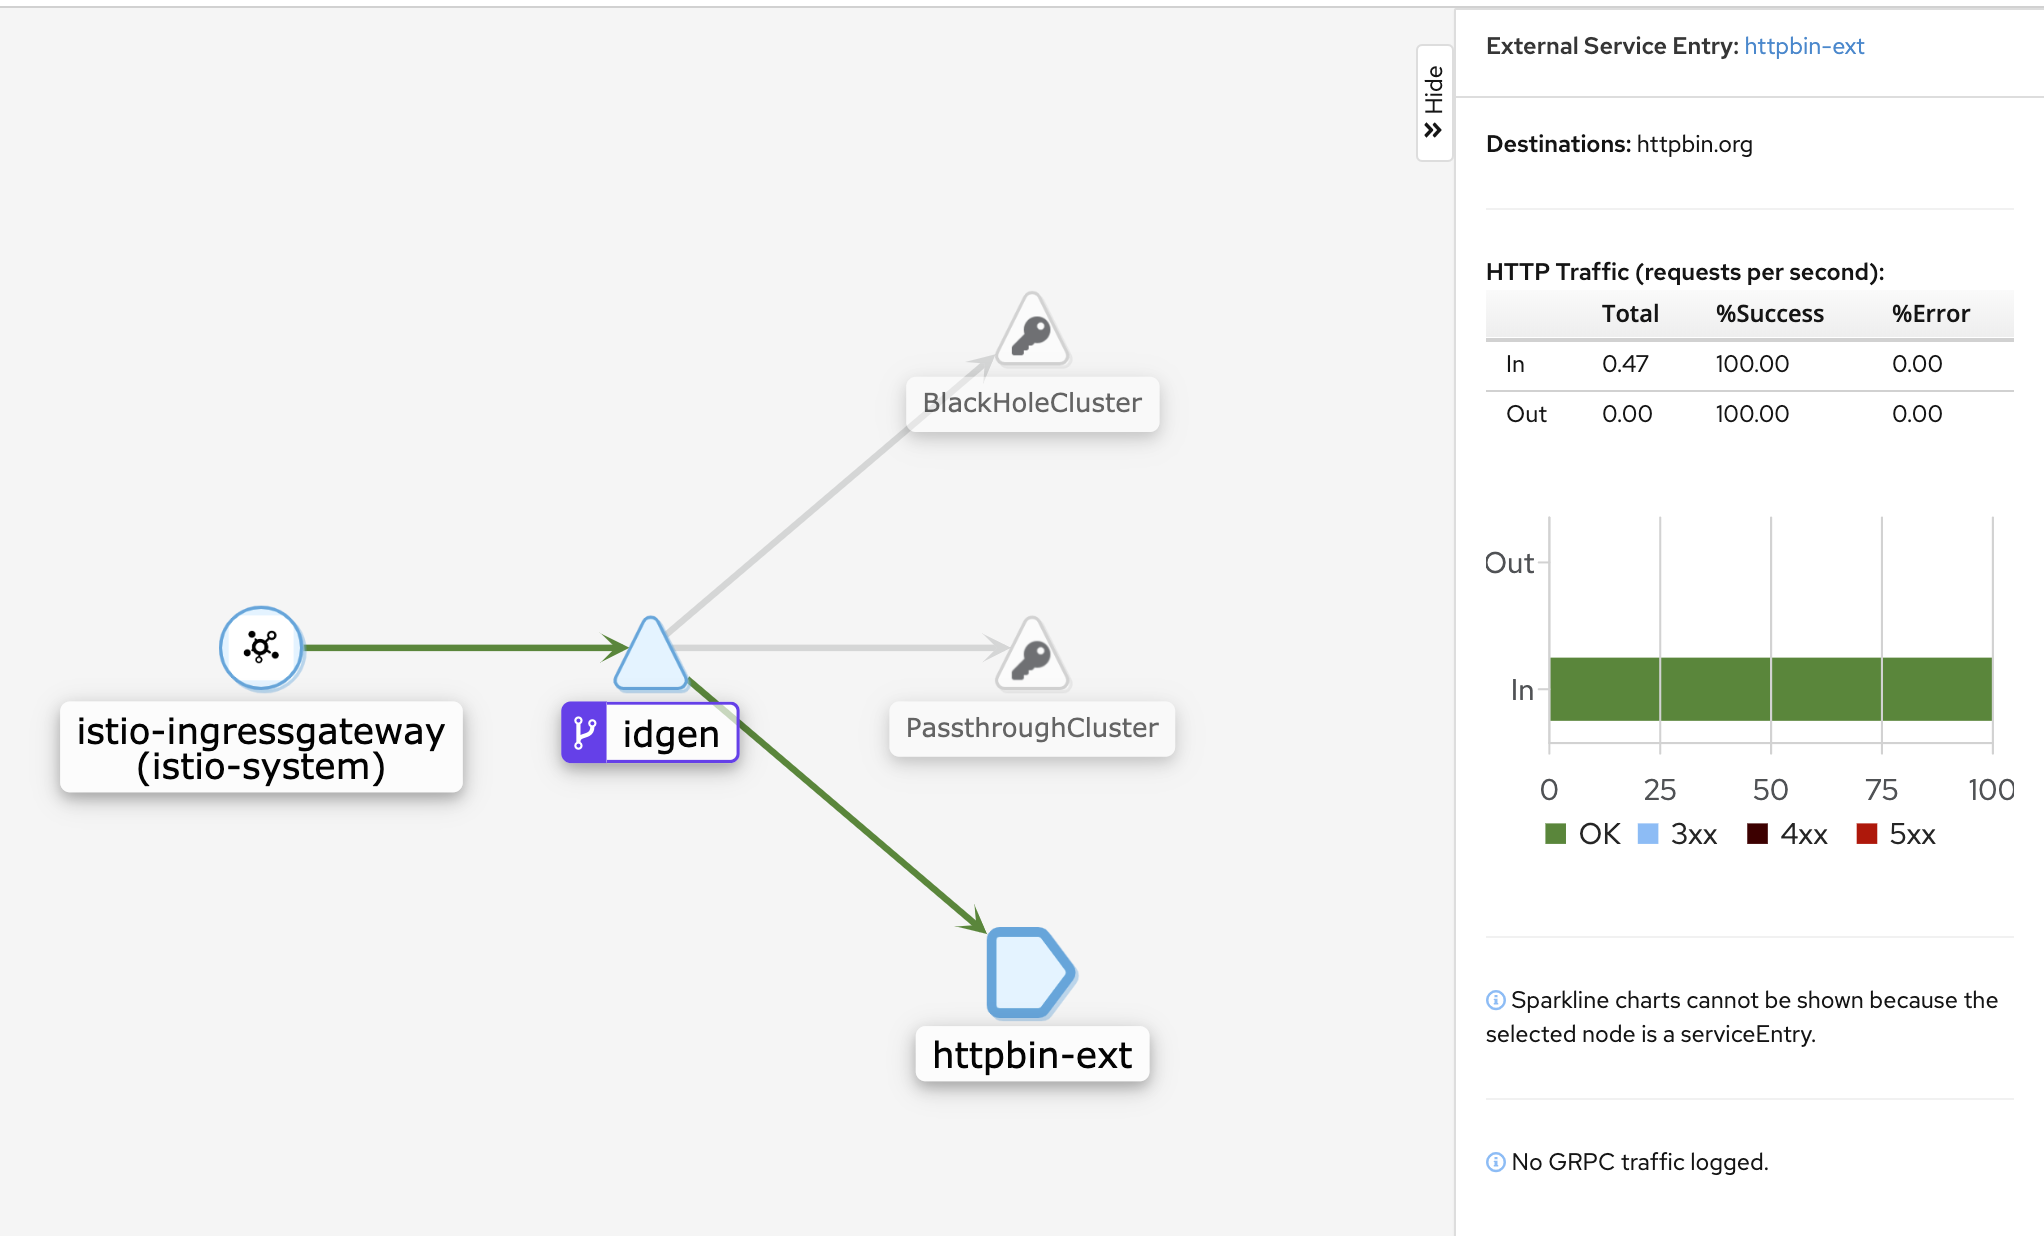
And note that with a ServiceEntry, Istio treats httpbin as another distinct mesh service, even though it’s external to the Kubernetes cluster and not part of the control domain. Now, we can get telemetry specifically for httpbin, and if we add another external service, it would appear as its own distinct node in the service graph.
To learn more about monitoring egress traffic: