Prometheus is an open-source monitoring tool. By default, Prometheus is installed alongside Istio, allowing you to use Grafana and Kiali to view metrics for both the Istio control plane and your Envoy-injected workloads.
But what if you’re already running Prometheus on your cluster, or you want to add extra customization to Istio’s Prometheus installation (for instance, add Slack notifications for Istio )?
Not to worry. You can bring your own Prometheus to Istio, with three quick steps.
First, update your Prometheus configuration. Prometheus relies on a scrape config model, where targets represent /metrics endpoints, ingested by the Prometheus server.
We’ll add targets for each of the Istio components, which are scraped through the Kubernetes API server. For instance, here is the configuration for Istio’s Pilot component:
    - job_name: 'pilot'
      kubernetes_sd_configs:
      - role: endpoints
        namespaces:
          names:
          - istio-system

      relabel_configs:
      - source_labels: [__meta_kubernetes_service_name, __meta_kubernetes_endpoint_port_name]
        action: keep
        regex: istio-pilot;http-monitoring
See configmap.yaml for a full example.
Second, update your Prometheus deployment to mount Istio’s certificates into Prometheus. This allows Prometheus to scrape Istio workloads when mutual TLS is enabled. To do this, mount in the istio.default secret into your Prometheus deployment YAML:
    volumes:
    - name: config-volume
        configMap:
        name: prometheus
    - name: istio-certs
        secret:
            defaultMode: 420
            optional: true
            secretName: istio.default
See deployment.yaml for the full example.
Once we deploy Prometheus with this new configuration, we have a Deployment and a Service running in a separate monitoring namespace:
$ kubectl get service -n monitoring

NAME         TYPE           CLUSTER-IP   EXTERNAL-IP      PORT(S)          AGE
prometheus   LoadBalancer   10.0.3.155   <IP>             9090:32352/TCP   21m
Lastly, update Istio’s configuration to use a custom Prometheus address. Here’s a helm template example using the Istio installation options:
helm template install/kubernetes/helm/istio --name istio --namespace istio-system \
--set prometheus.enabled=false \
--set kiali.enabled=true --set kiali.createDemoSecret=true \
--set kiali.prometheusAddr="http://prometheus.monitoring.svc.cluster.local:9090" \
--set "kiali.dashboard.jaegerURL=http://jaeger-query:16686" \
--set "kiali.dashboard.grafanaURL=http://grafana:3000" \
--set grafana.enabled=true \
--set grafana.datasources.datasources.datasources.url="http://prometheus.monitoring.svc.cluster.local:9090"  > istio.yaml
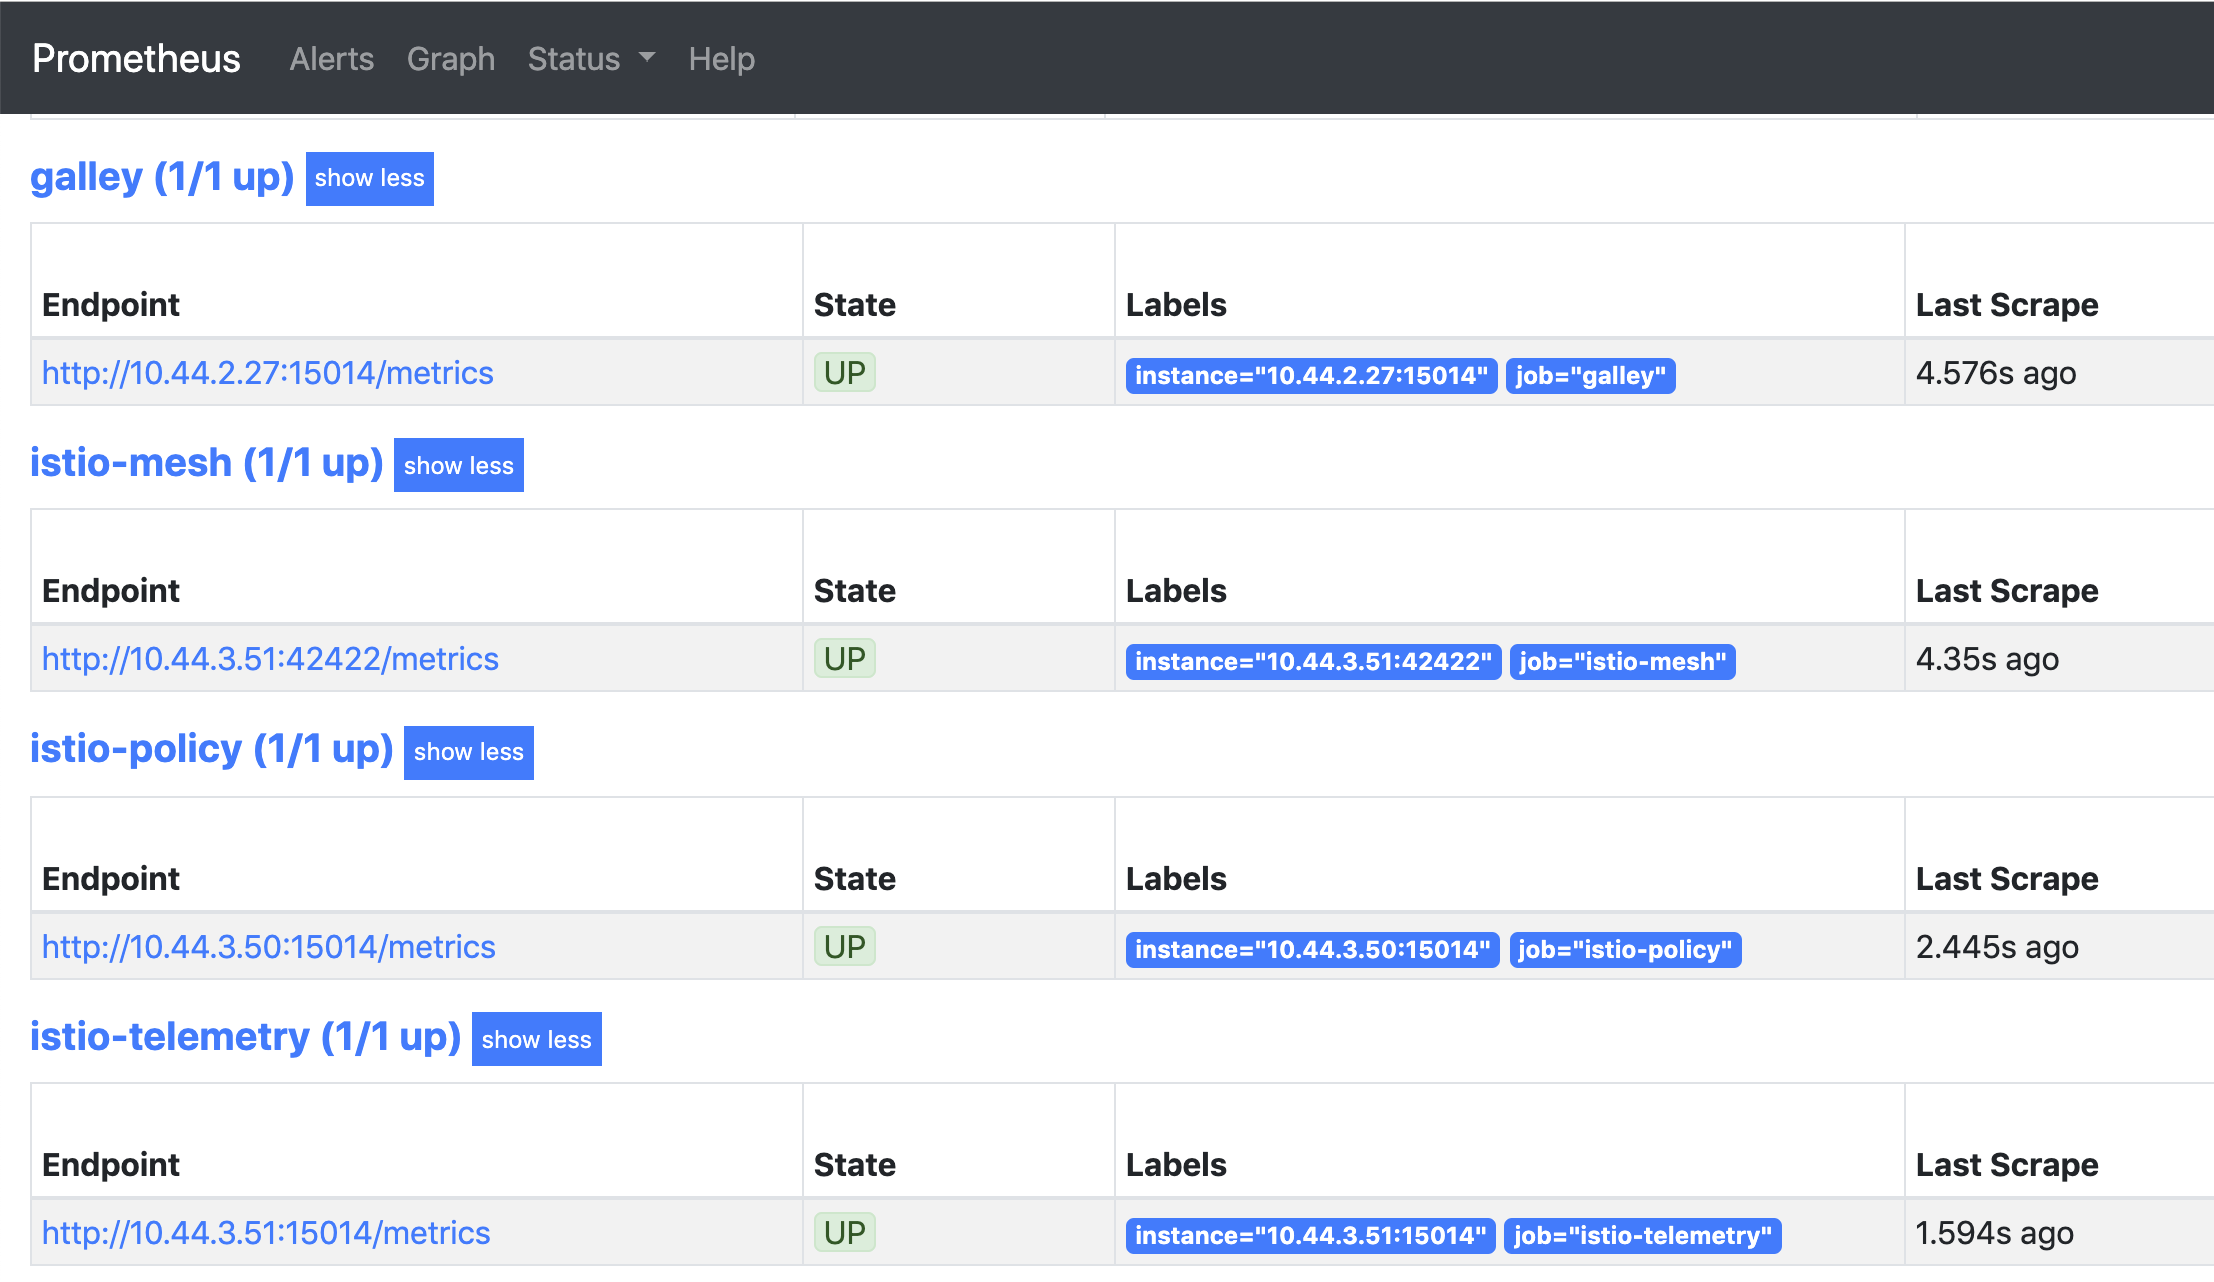
Once Istio and Prometheus are both installed, and we deploy some Istio-injected workloads to our cluster, we can see that Prometheus is successfully scraping our Istio targets:
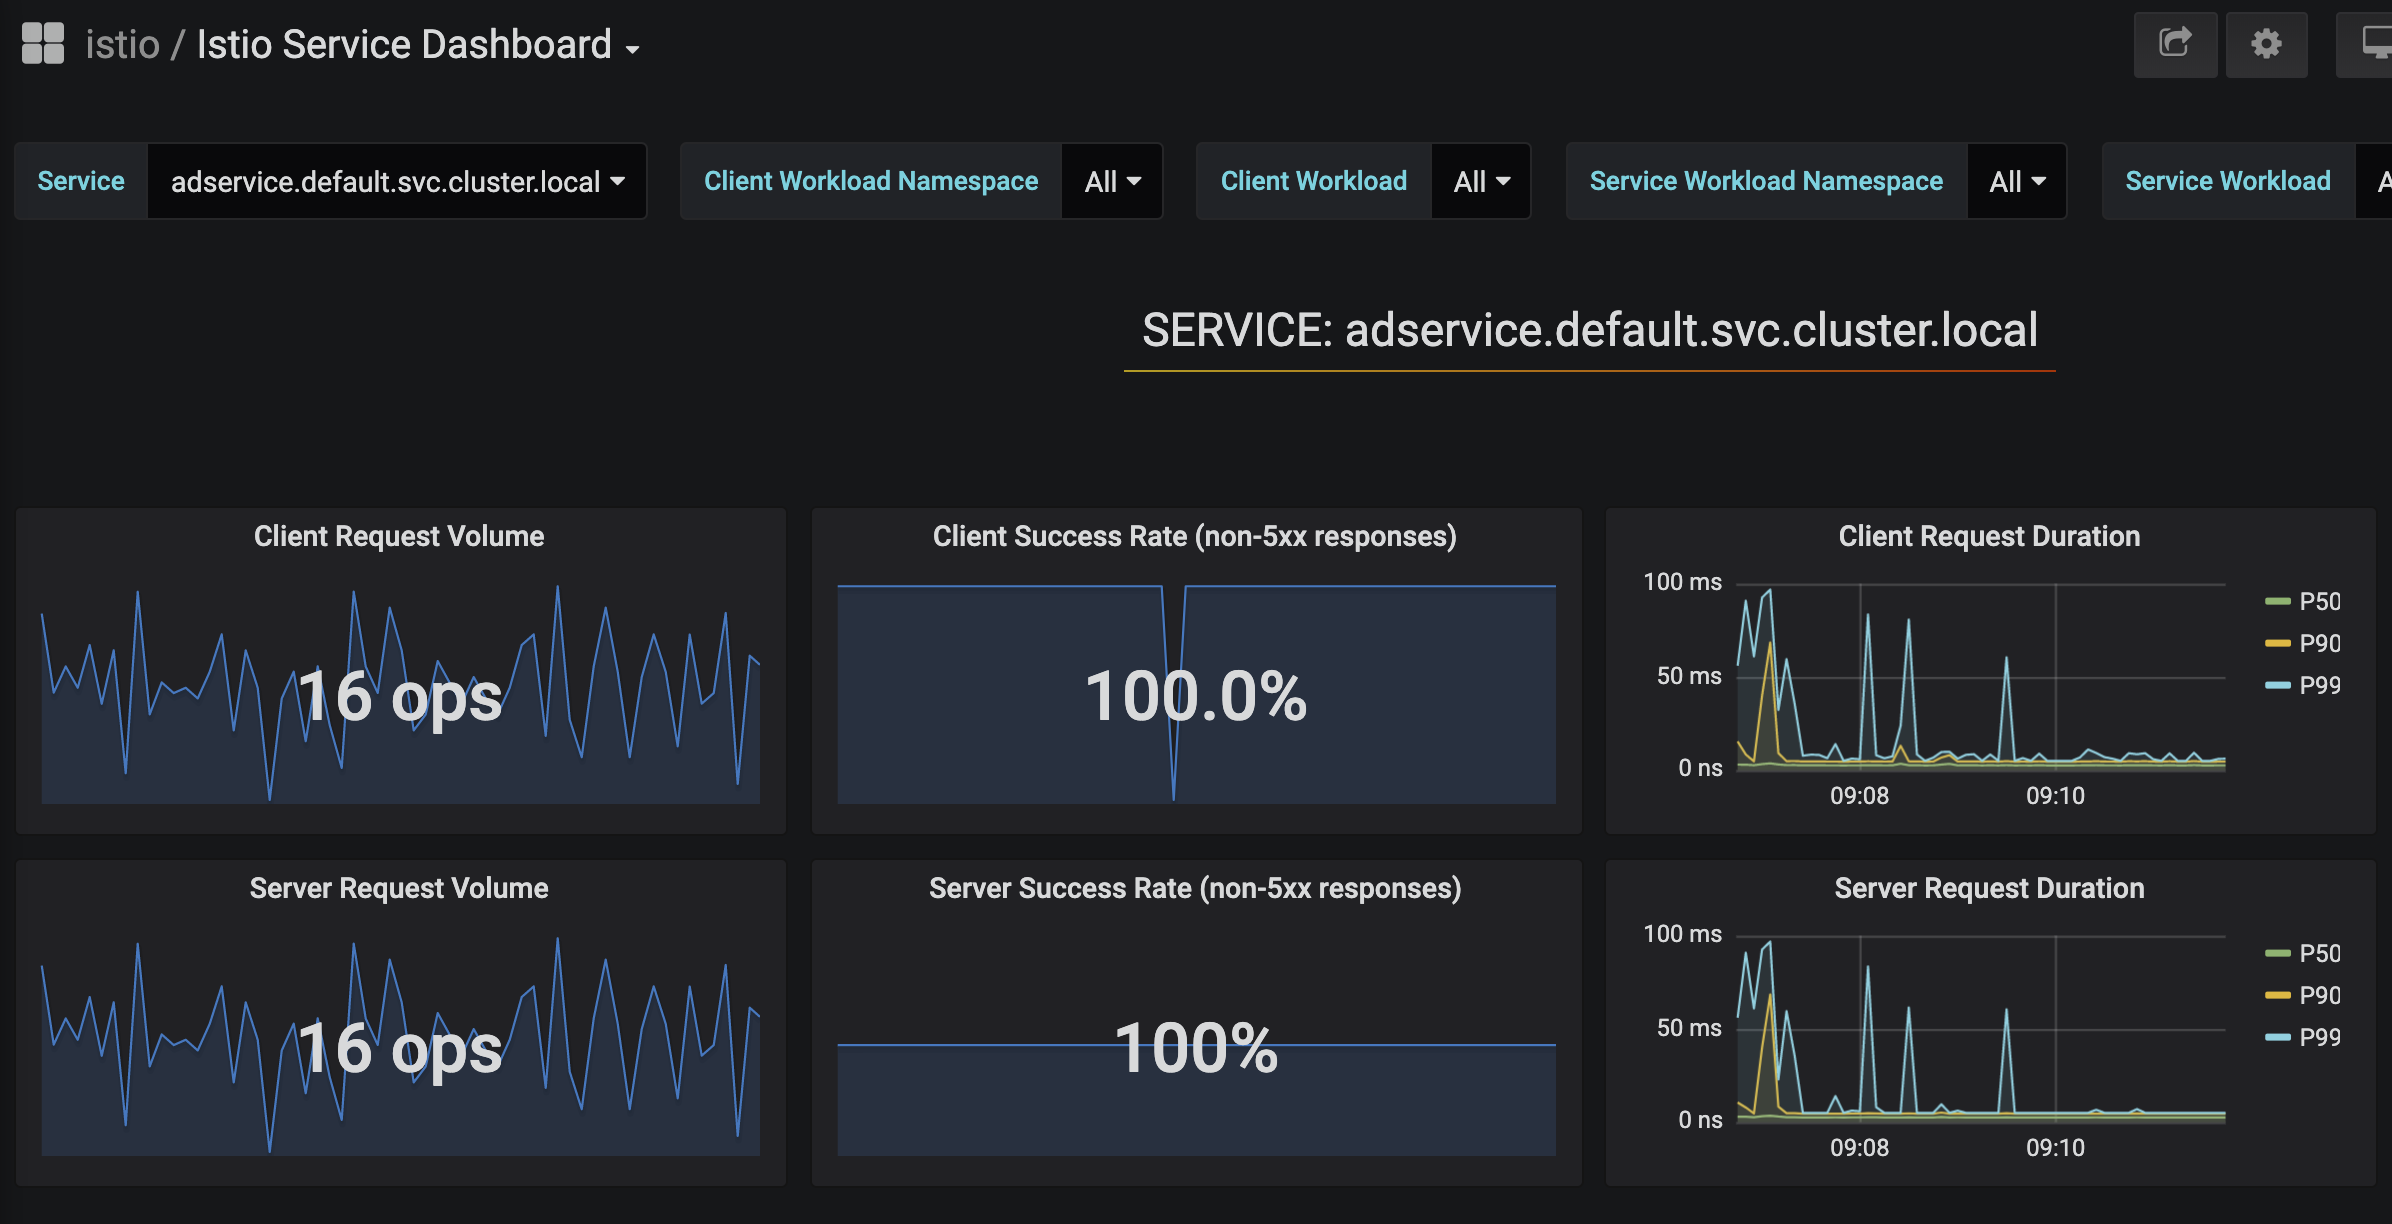
Grafana can fetch service-level metrics:
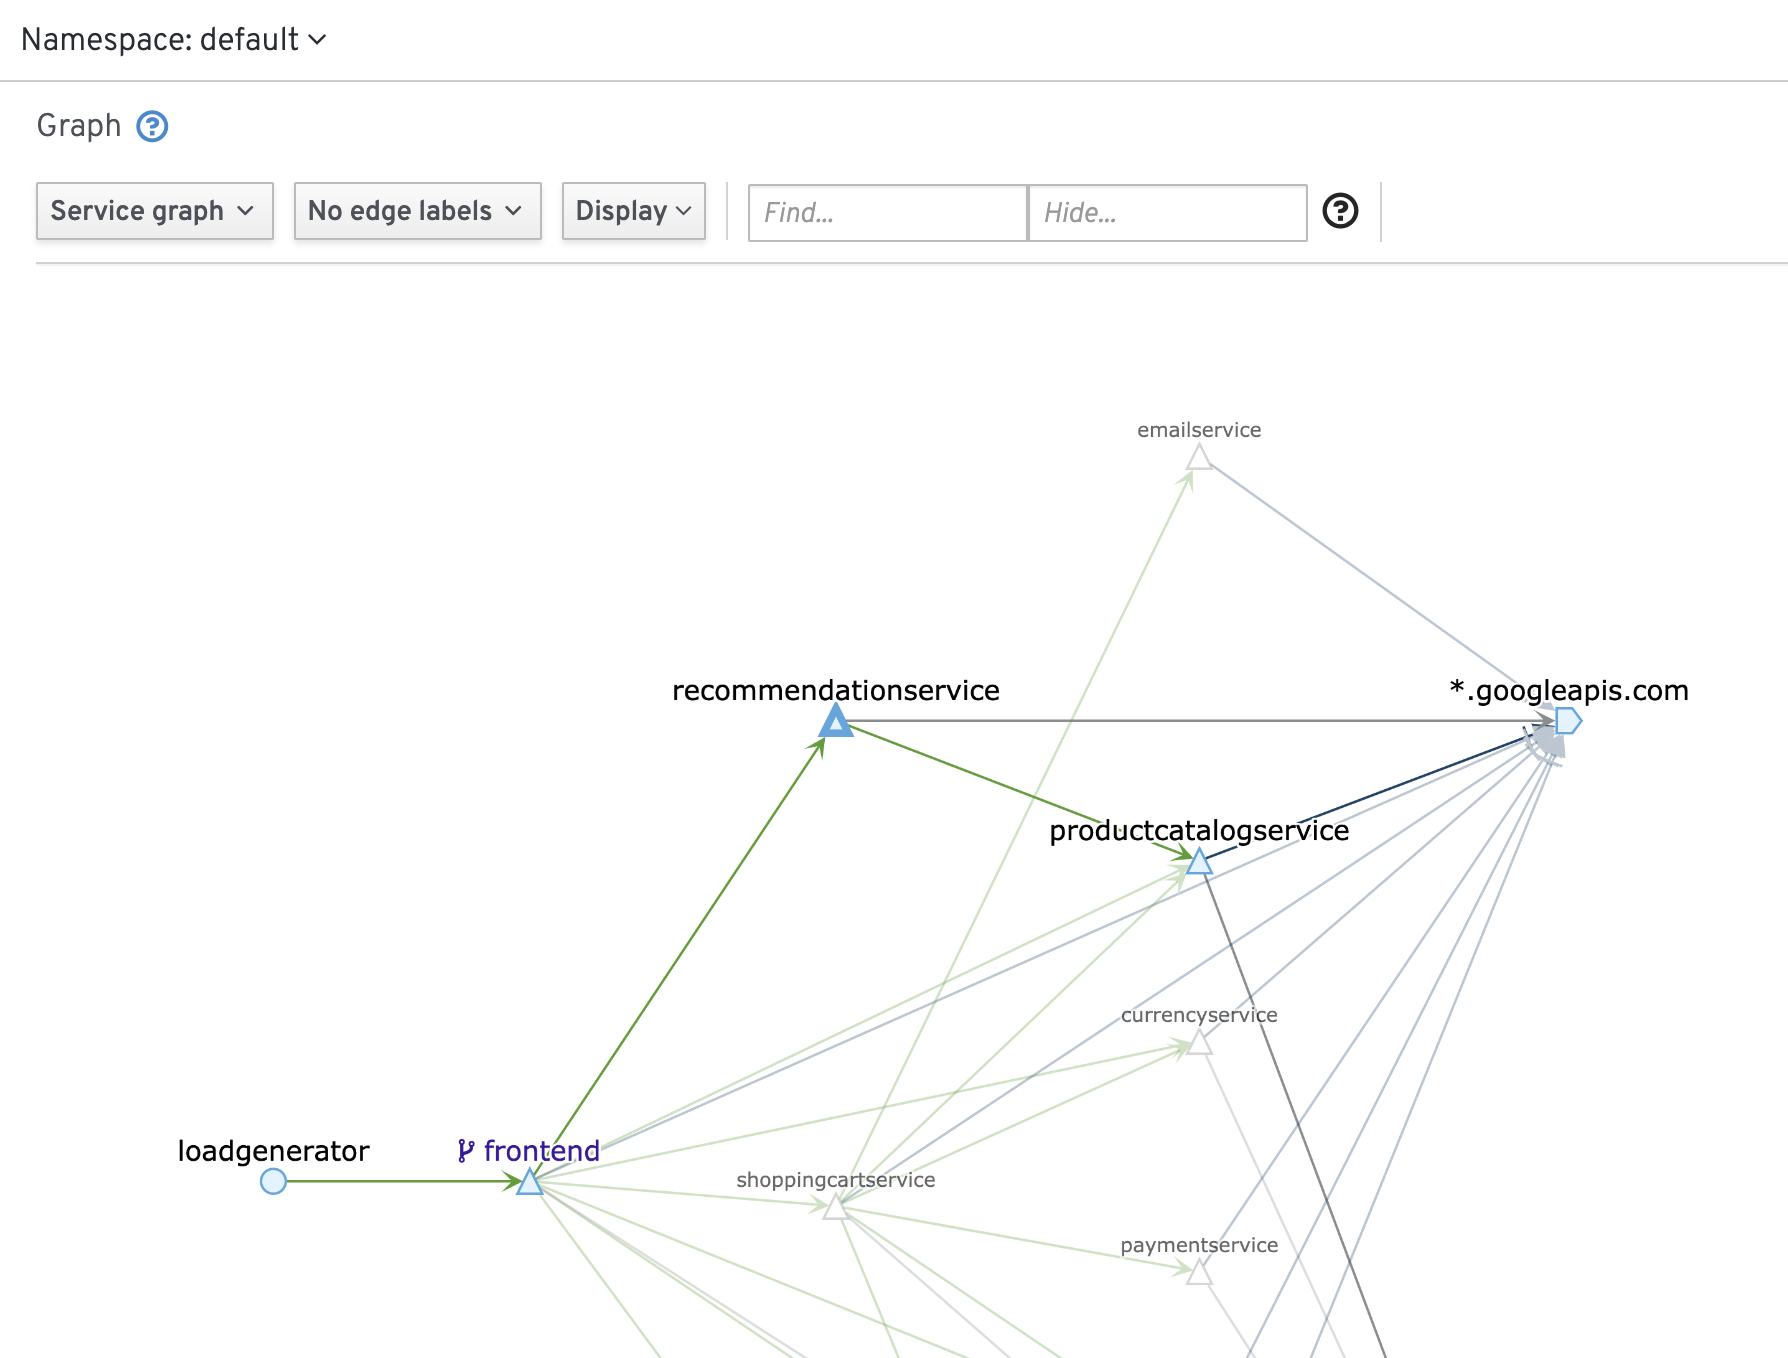
And Kiali can display the service graph: